Digital Image 17-1
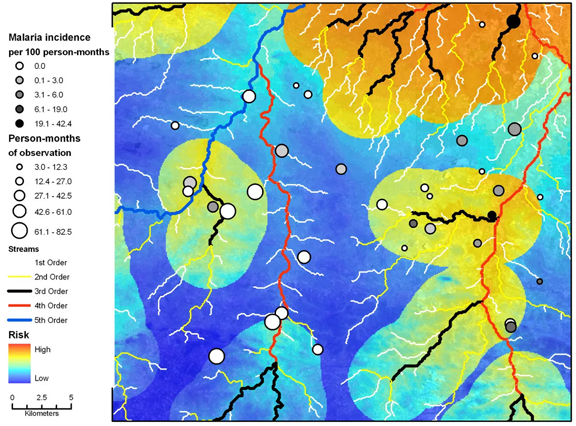
Malaria cases and the malaria risk map, southern Zambia. Households with and without incidence malaria cases are overlaid on the malaria risk map with first through fifth order streams. The size of the circle represents the number of person-months of observation within each study household. From W. J. Moss, H. Hamapumbu, T. Kobayashi, T. Shields, A. Kamanga, J. Clennon, S. Mharakurwa, P. E. Thuma, and G. Glass. 2011. Use of remote sensing to identify spatial risk factors for malaria in a region of declining transmission: A cross-sectional and longitudinal community survey. Malaria Journal, 10:163. Figure 4. http://malariajournal.biomedcentral.com/articles/10.1186/1475-2875-10-163 (accessed October 2019.