Digital Image 16-1
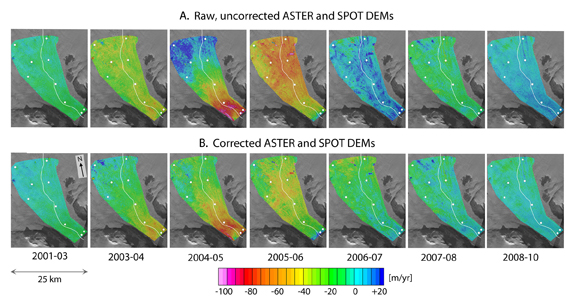
Elevation change rates between 2001 to 2010 from ASTER and SPOT DEMs in the lower drainage basin of the Kangerlussuaq Glacier (area outlined by a dashed line in Figure 16-10). The white line marks the central flowline. White dots are sites used to register the DEMs to the altimetry time series. From T. Schenk, B. Csatho, C. van der Veen, and D. McCormick. 2014. Fusion of multi-sensor surface elevation data for improved characterization of rapidly changing outlet glaciers of Greenland. Remote Sensing of Environment, 149, 239–251, Figure 9. Reused with permission of Elsevier.
A. Annual elevation change rates computed from uncorrected ASTER DEMs.
B. The results after applying the height adjustment derived from the altimetry record.