Image 41 of 46
Previous
Home
Next
Digital Image 15-2A
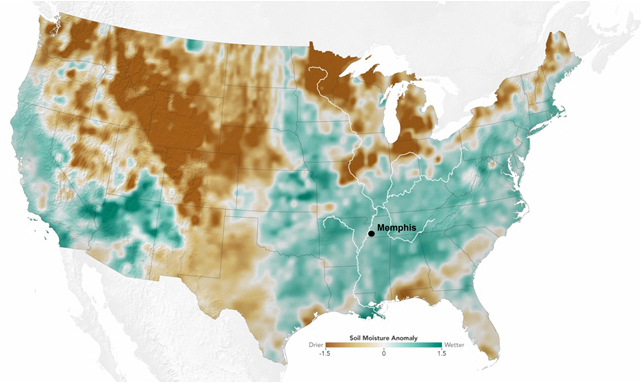
Soil moisture maps of the United States. Soil moisture anomaly map that shows how much moisture is stored near the land surface compared to normal for February 21, 2019. Courtesy JPL and the SMAP Science Team.
Image 41 of 46
Previous
Home
Next