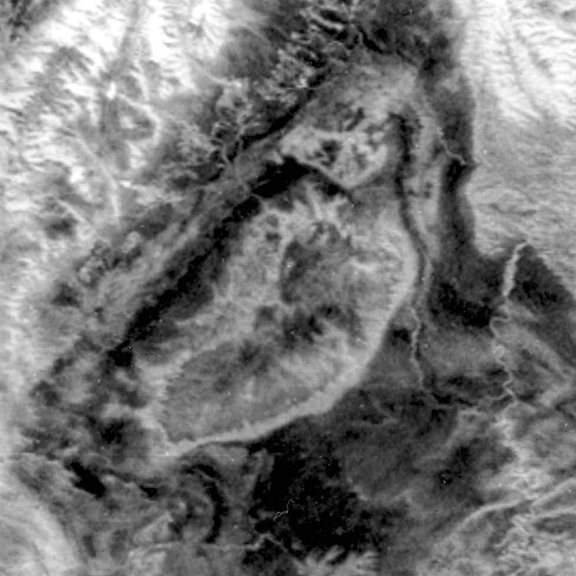
Image 13 of 46

Previous Home Next

Digital Image 5-1D<br>Enlarged HCMM images of the San Rafael Swell, Utah. Apparent thermal inertia (ATI) image. Dark tones display low ATI values and light tones show high ATI values. Courtesy A. B. Kahle, JPL. From A. B. Kahle, J. P. Schieldge, M. J. Abrams, R. E. Alley, and C. J. LeVine. 1981. Geologic Applications of Thermal Inertia Imaging Using HCMM Data (Publication 81-55). Pasadena, CA: Jet Propulsion Laboratory.
Digital Image 5-1D
Enlarged HCMM images of the San Rafael Swell, Utah. Apparent thermal inertia (ATI) image. Dark tones display low ATI values and light tones show high ATI values. Courtesy A. B. Kahle, JPL. From A. B. Kahle, J. P. Schieldge, M. J. Abrams, R. E. Alley, and C. J. LeVine. 1981. Geologic Applications of Thermal Inertia Imaging Using HCMM Data (Publication 81-55). Pasadena, CA: Jet Propulsion Laboratory.

Image 13 of 46

Previous Home Next