Image 42 of 46
Previous
Home
Next
Digital Image 15-2B
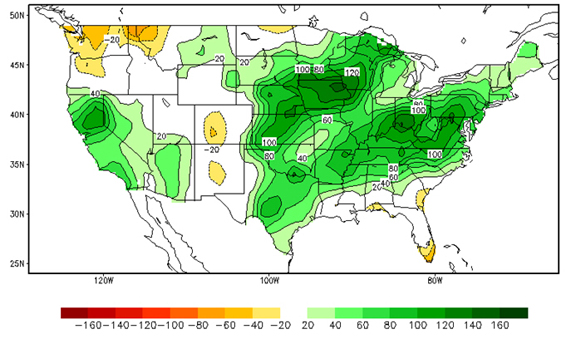
Soil moisture maps of the United States. Calculated soil moisture anomaly map for March 2019. Courtesy National Weather Service Climate Prediction Center.
Image 42 of 46
Previous
Home
Next