Digital Image 15-1
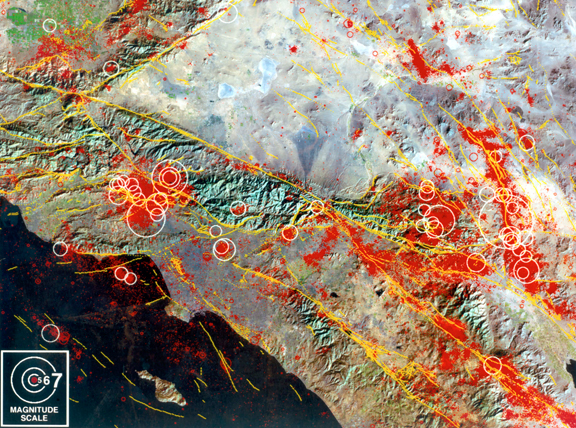
Mosaic of TM images of southern California. Band 7 is shown in red, band 4 in green, and the average of bands 1 and 2 in blue. Yellow lines are traces of active faults. White and red circles and dots are magnitude of earthquakes recorded from 1970 to 1995 by the Southern California Seismic Network. The red patches are clusters of small earthquakes. Courtesy R. E. Crippen, JPL.